
In the last few months, I’ve come across about a dozen Commercial Real Estate articles with panic-inducing headlines. If I understand the consensus, it seems we’re just minutes away from global calamity and CRE is “the next big short” (as one Forbes article puts it).
I’m equal parts optimist and skeptic, so I had to satisfy my own curiosity about this situation. After spending a little time digging into the data from the perspective of the banks that lend against CRE assets, I walked away with the six takeaways below.
- It’s true. Commercial Real Estate Concentrations have been on the rise recently.
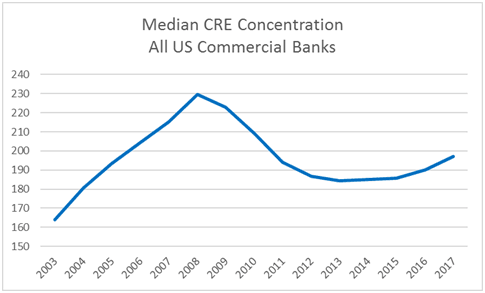
The chart above displays the median CRE Concentration of All US commercial banks since 2003. By “CRE Concentration”, we’re referring to the ratio of Commercial Real Estate Loans divided by Total Risk-Based Capital. From a risk perspective, this is a commonly used ratio to represent “CRE Concentration” in a bank’s risk profile. For this analysis, we’ve used 4th quarter data for each year indicated.
My eyes are drawn to a few major trends since 2003:
- Median CRE concentrations steadily increased in the years leading up to the global financial crisis (2003-2008),
- Decreased during the Great Recession and established a new floor (2008-2014),
- And indeed, have been trending back upward in recent years (2014-2017), causing some concern that we may be repeating past mistakes.
The 2017 median Commercial Real Estate Concentration is nearly identical to that of 2005 and, in this context, I understand the growing concern among some in the sector. Are we committing the sins of the past and headed toward another Great Recession?
- We are not in the same place we were in 2005.
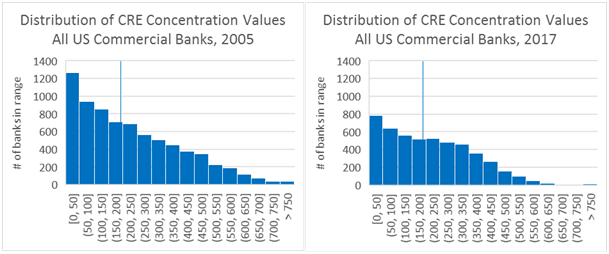
Though the medians for 2005 and 2017 were nearly identical (the thin vertical line), the distributions of values for all banks in those respective years suggest some important distinctions.
In 2005, the distribution included a long “tail” of banks with exceptionally high CRE Concentrations. As we now know, many of those in the tail were banks that failed in the subsequent downturn.
In the 2017 distribution, though, the tail is shorter and “fatter” as banks’ CRE Concentrations have shifted to the left and clustered more closely to the median. Yes, there are still a handful of extreme outliers in the 2017 distribution. But it seems, from this perspective, the sector’s banks are generally exhibiting a less risky makeup than they did in 2005.
- Growth is more controlled.
In the years following the Great Recession, the banking sector conducted several post-mortem analyses to identify the warning signs we failed to fully heed. One of the conclusions that bubbled to the top was that it was not just the CRE Concentrations that were problematic, but it was also their rapid pace of growth that was unsustainable.
The FDIC recognized this issue in 2006 as they saw many banks adopt a growing appetite for CRE yields that was outpacing their underwriting capabilities. Along with other regulatory bodies, they issued interagency guidance to help curb this. However, as we now know in hindsight, Commercial Real Estate was just one of many factors behind the financial crisis and this regulatory guidance may have been too little and too late.
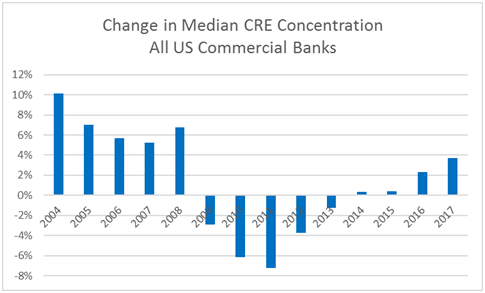
It’s in this context that I pulled together the above chart which shows growth rates for Median CRE Concentration. A couple of things pop out at me:
- The median growth rates prior to the recession were incredibly high. How could anyone think this was sustainable?
- More recently, we’ve only seen actual growth in Median CRE Concentration in the last couple of years, and nothing like the growth we saw prior to 2006. A very different picture than pre-recession.
It’s worth noting that the growth trajectory that seems to be establishing (from 2014 to 2017) would lazily suggest we’ll see 6% growth rates by Q4 2018. However, we may also see the effects of regulatory guidance and sound self-governance kick in before that occurs.
As my (every?) college statistics professor used to say, “two points do not make a trend”. Since 2016 and 2017 were the only recent years that have experienced even single-digit growth in Median CRE Concentrations, we’ll need to monitor 2018 closely to see what trend actually evolves. For now, though, the conclusion one might draw is that 2017’s 3.74% growth in Median CRE concentrations, while a bit warm, is nothing like the growth leading up to the Great Recession.
- Portfolios are growing differently than before the recession.
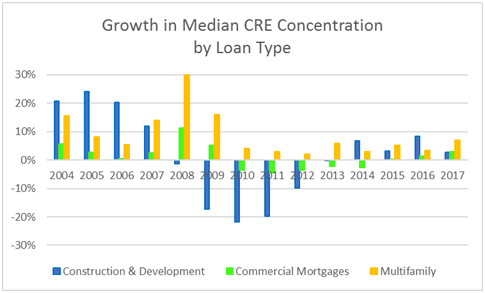
Digging more deeply into the growth rate topic, the chart above looks at median CRE Concentration growth rates by CRE loan type. For the uninitiated, Commercial Real Estate loans are often grouped into three categories:
- Construction & Development loans, sometimes called CLD (Construction and Land Development), are used to finance the development of land and the construction of improvements and buildings. These are generally considered more volatile because they tend to be more speculative in nature, shorter in a term, and more closely tied to the swings of economic cycles.
- Multifamily loans are loans used to finance residential apartments with 5 or more units. Multifamily loans are generally considered to be less risky than CLD loans because they are longer in term and they are tied to a more permanent societal need (housing).
- Commercial Mortgages are used to finance the purchase of commercial real estate that includes offices, retail, industrial, hotel, and mixed-use properties. In terms of risk, these are generally considered to be less volatile than CLD, but not quite as stable as Multifamily.
Looking again at the chart, the volatility of CLD loans is easy to see in the cyclical pattern of the blue bars. Similarly, the trailing pattern of Commercial Mortgages in the green bars behaves about as expected. So, in hindsight, this is just about the picture we would expect from these two loan types, given the economic conditions at the time.
However, a few things do stand out. First, every year I looked at, the measure of median multifamily loans as a percent of RBC has been steadily growing (the orange bars are consistently above 0%).
Also, the chart indicates that the more speculative CLD loans grew in 2017 at a pace that was just a fraction of the 20%+ rate they were growing in 2005.
Lastly, the growth rates in CLD post-recession do not point to an unsustainable, parabolic growth pattern (growth rates themselves constantly trending up) as they did pre-recession. But rather, they bounce around between a “lukewarm” 3 percent and a “heating up” 8 percent.
Considering the above, it seems the sector is growing it’s CRE portfolio in some ways that are quite different than before the financial crisis. In general, the rate of growth seems to be more stable and more sustainable relative to the pre-recession build up.
- Non-core funding dependence is down (sort of…)
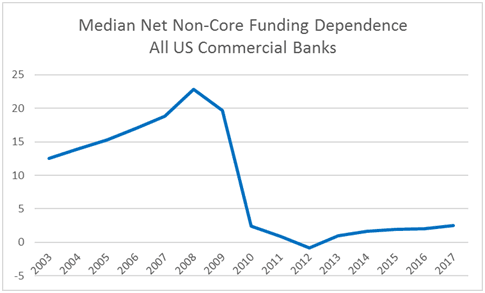
So, what is Net Non-Core Funding Dependence and why does it matter? The FDIC defines this ratio as “non-core liabilities less short-term investments divided by long-term assets”. They go on to further explain the specifics of each of those components in a couple of paragraphs that made my eyes glaze over, so I’ll skip the rest.
The main thing to know is that net non-core funds are not a stable match for funding long-term loans. In this regard, regulators monitor this ratio closely as an indicator of a bank’s liquidity risk exposure during a downturn.
One conclusion is easy to draw from a glance at this chart—high levels of median Net Non-Core Funding Dependence preceded the financial crisis, but they have not returned since. From the perspective of this metric, it appears as though the sector is in a markedly better position to respond to changing economic conditions.
But, not so fast…
Without fully understanding the details beneath this ratio’s numerator and denominator, it would be easy to end the analysis here. However, it turns out those data definition details that made my eyes glaze over earlier in this section are pretty important to this story.
In 2006, the FDIC published an analysis which questions the stand-alone value of the Net Non-Core Funding Dependence ratio in today’s banking context. In short, the traditional banking business model of managing a balance sheet of traditional funding and lending has been significantly disrupted by technology, innovation, and economic realities.
As a result, today’s banks more often pursue off-balance sheet funding strategies that don’t always register in a traditional “core/non-core” context. The liquidity implications of this cannot (yet) be captured in a single tidy ratio and the FDIC recommends a more detailed cash-flow analysis as a supplement.
Despite these concerns, the sector’s regulatory agencies (through their consortium, the FFIEC) agree that this ratio is still one (of several) important (though perhaps less important than in the past) indicators of liquidity.
- Several aspects of the sector’s overall CRE risk profile appear to be less risky.
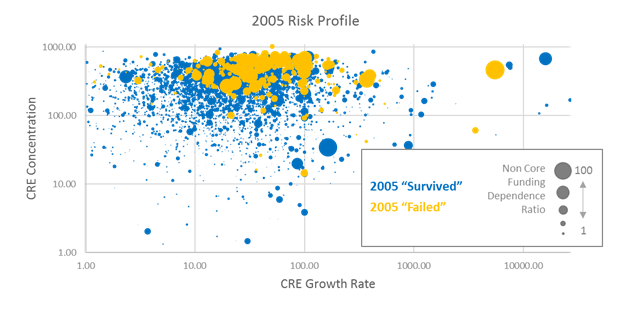
One of the findings from the post-mortems conducted after the last financial crisis was that there was no single factor that would have accurately predicted a bank’s failure. However, the Richmond Fed found that banks that had a combination of High CRE Concentrations, High CRE Growth, and High Noncore Funding Dependence had a significantly higher chance of failing.
The first chart above displays this reality. Together, the blue and orange dots represent all US commercial banks in 2005. The orange dots represent the banks that ended up on the FDIC’s failed bank list after the financial crisis. Note that these orange dots are higher (high concentrations of CRE) and to the right (higher CRE growth) relative to the blue banks that survived.
The size of the dots represents the level of dependence on noncore funding. Note that there’s a high number of small pinpoint dots that are blue (survivor banks that had low dependence on non-core funds), but most orange dots are larger (failed banks with higher non-core dependence)
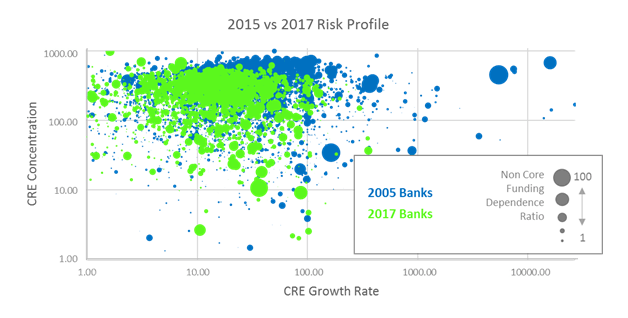
The second chart compares the same three risk factors for 2005 and 2015. The blue dots represent all commercial banks in 2005 (both those that failed and those that survived). The green dots represent all commercial banks in 2017.
From 2005 to 2017, the mass of banks has shifted down and to the left, indicating lower CRE Concentrations and lower Growth Rates. This new position has almost completely abandoned the region of the chart that contained the orange (failed) banks. It’s also worth noting that the green outliers that do exist in 2017 are generally much smaller dots (i.e. lower noncore funding ratios) than the blue outliers from 2005.
Indeed, the second chart suggests a less risky sector profile in 2017 than in 2005.
So What’s next?
Together, I think these charts help to paint a more nuanced picture of the “CRE Crisis” that many believe, is headed towards a bank near you. While there are some warning signs around growing median CRE Concentrations, there are also some clear indicators that the sector is structured differently than before the Great Recession. The optimist in me concludes that we’ve applied the painful lessons learned and are managing those risks better.
The half of me that is a skeptic, however, believes our next crisis might still be forming underneath the details of the sector’s more complex risk-weighting regime and its less understood off-balance-sheet activity. For example, companies like Amazon and PayPal are increasingly offering services that look and feel an awful lot like banking. As these firms continue to operate outside of traditional bank regulation, the risks of another CRE crisis may pale in comparison to the devil we do not yet know.
To learn about Qaravan’s more user-friendly, intuitive approach to CRE, you can contact us at support@qaravan.com.
