During the Great Recession, commercial real estate (CRE) lending practices were heavily scrutinized and considered to be a leading factor of economic downturn. As a result, bank concentrations in CRE are assumed to be a strong predictor of bank failures.
Over a decade later, rising bank CRE lending concentration levels accompanied by historically high CRE prices have many economists convinced that regulations need to be revisited so history doesn’t repeat itself. As they debate whether or not current CRE lending practices are an accurate prognosticator, recent Qaravan data tells a far more nuanced story.
In order to accurately and thoroughly assess risk by benchmarking against risk and performance metrics, we have to consider context; the answer to “How are we doing?” should start with “Compared to what?” To garner that context and provide a more thorough understanding of CRE Concentration, we can take a look at fourth quarter data as far back as 2002.
For this analysis, CRE Concentration refers to the ratio of CRE loans divided by total Risk-Based Capital (RBC) and is commonly used in a bank’s risk profile. Rising rates of CRE Concentration are taken to be an indicator of impending economic crisis. Considering how CRE Concentration is measured and looking at the distribution of increases and decreases in concentration across banks and by size of bank in addition to location of increased concentration gives reason to question financial crisis predictions.
Sector-wide CRE Concentration Rise or Decline Depends on How The Data is Measured

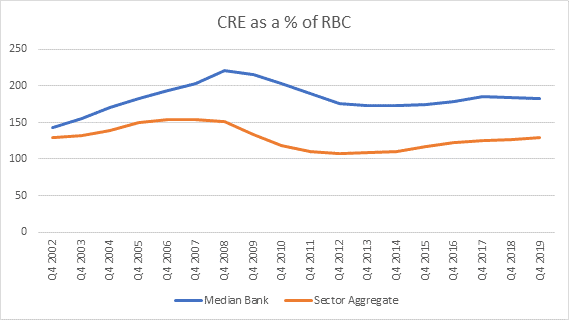
If we only look at sector aggregates, CRE Concentration is on the rise. Taking the total value of all CRE loans and dividing it by the total value of all RBC during the same period yields an aggregate ratio for the sector. While this provides a glimpse into how all the banks in a sector are performing collectively, it is not the only way to measure sector performance.
Instead, by calculating the ratio for each bank in a sector during a given period, we can identify the median value, which gives us a clearer depiction of how “the average bank,” is performing within a sector and a better sense of how banks are performing individually.
At first glance, the consistently rising Sector Aggregate measurement draws concern. But the Median Bank measurement suggests that drilling down into individual bank behaviors and then comparing how banks are behaving on average draws a different picture. Taking a look at median values, we see a peak in 2017 and then a slow and steady decline.
The two measurements provide a metric for assessing the threat of economic crisis but yield surprisingly different results.
Increased CRE Concentrations Are Not Uniform

The movement towards increasing CRE lending is not monolithic; for every three banks that have increased their CRE Concentration, two banks have proportionately decreased it. In other words, not all the banks are doing it, not all of them are doing it at the same frequency, and some are refraining altogether.
Looking again at CRE as a percentage of RBC between fourth quarter 2002 and fourth quarter 2019, we see a clear increase regardless of measuring in aggregate or by median. What that chart does not depict is how many banks are causing this rise. It leaves us asking: what’s the distribution of the data across banks?
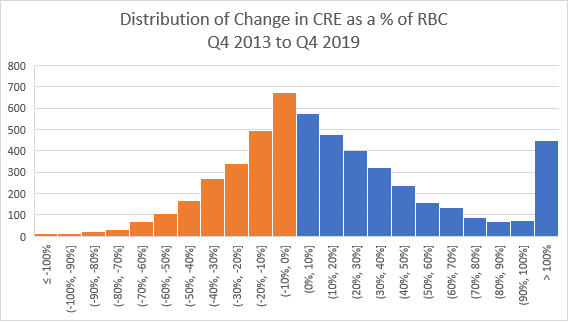
Looking at the rate of CRE Concentration changes between 2013 and 2019 while grouping a sector’s banks into cohorts according to percentage rates of RBC gives us a better sense of the distribution of these changes.
The blue bars represent bank cohorts that increased CRE Concentration since 2013, whereas the orange bars represent bank cohorts that decreased CRE Concentration. While 2,965 banks have increased concentrations, 2,026 banks have decreased their concentrations. If we only considered the increases, we would fail to see that it is not quite as concerning relative to the simultaneous decreases.
Additionally, considering the rates within cohorts, we can see that while CRE Concentration is consistently on the rise, the rate of concentration increase is not evenly distributed across a sector’s many banks.
Perhaps most notable are the 449 banks that more than doubled their CRE concentrations since 2013 or who started new CRE lending programs since that time.

The Bigger the Bank, the Bigger the Exposure
Having considered how we measure increased CRE Concentration and how that concentration is distributed, we still do not know if that distribution is amongst particular sizes of banks. Are only big banks increasing CRE Concentration? What are small and medium banks doing?
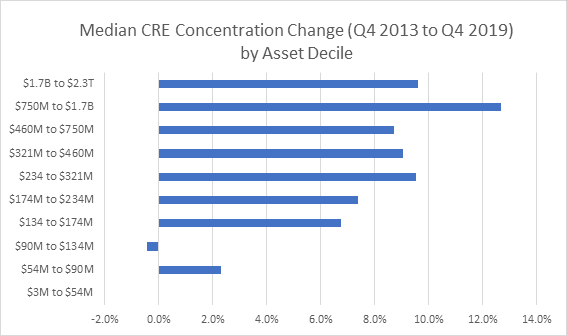
The chart above splits the sector’s banks into ten equal groupings based on asset size. Known as deciles, each of these groups contains the same number of banks equal to ten percent of total banks; the decile of banks between $3M and $54M in assets represents the smallest 10% of banks in the sector, the decile of banks between $1.7B and $2.3T represent the largest 10% of banks, and each decile in between represents a similar 10% tranche of banks.
Within each decile, we’re looking at the Median rate of change in CRE Concentration between the lowest point of our recent upward trend, fourth quarter 2013, and the latest data set available, fourth quarter 2019. The overall pattern across the deciles depicts a correlation between bank size and CRE Concentration in which the bigger a bank, the greater the CRE Concentration.
Considering this trend over time, we can conclude that larger banks in the sector have been increasing CRE Concentration at a much faster rate than smaller banks. This rate to size correlation is an important consideration because it mirrors a pattern observed in the run up to the last financial crisis: the vast majority of smaller community banks maintain stable, long term lending strategies and policies associated with portfolio concentrations.
The Three Most Important Things About Real Estate Remain: Location, Location, Location.

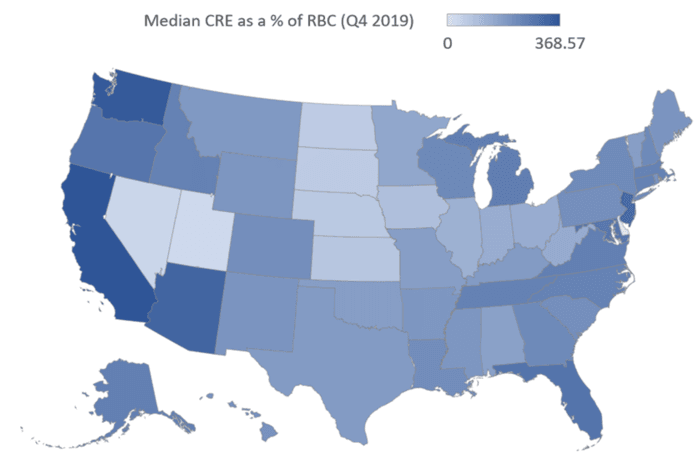
Aside from looking at distribution according to the size of banks, we can also consider distribution according to where a bank is located. In doing so, we contextualize the bank geographically and compare it to its local market.
Looking at the map, CRE concentrations vary significantly across the country. We see higher or lower median CRE concentrations in pockets: Whereas “flyover country” varies from lightest blue to medium blue, suggesting less concern for economic crisis, the darkest pockets indicating higher median CRE concentrations are in fewer states.
Fully assessing the risk these pockets of higher median CRE concentrations pose should take into consideration other market factors. For example, California and Washington are very dark blue, indicating the highest median CRE concentrations, and these states also have large amounts of tech money flowing through their market.
If we take a minute to dig deeper and interpret the data relative to other data, we glean a more complete, contextualized understanding of CRE Concentration and the risk it may or may not impose
What is currently billed as a sector-wide CRE crisis is actually more nuanced. Looking at both increases and decreases of CRE Concentration allows us to better understand the pervasiveness of increased concentration.
Similarly, looking at this distribution according to bank size and location allows us to determine which banks are making these increases and where, so that local market fluctuations can also be taken into consideration.
While bigger banks in hot markets are certainly seeing greater exposures, thousands of smaller community banks across the country seem to be sitting this one out.
Tony Hodson is Senior Vice President of Market Data at OTC Markets Group. Tony leads QaravanSM, an integral part of OTC Markets Group’s suite of data products are designed to provide intuitive risk & performance analytics on more than 5,000 U.S. banks to banking and financial industry professionals. Connect with Tony at tony@otcmarkets.com.